


Barry University President Mike Allen, Ph.D.
Mike Allen, Ph.D. became the seventh president of Barry University on July 1, 2019. An experienced higher education administrator, Dr. Allen skillfully marshaled the institution through the global pandemic all while boosting its progress, and creating an impressive strategic framework for the future.
From the outset of his tenure, the institution realized significant achievements including three consecutive academic years of freshman enrollment growth, being listed as one of the 2022 U.S. News & World Report Best Colleges for Social Mobility among National Universities, and named one of America’s Top Colleges in 2021 by Forbes. True to Barry’s Adrian Dominican heritage, President Allen has made engagement and service to the South Florida Community a top priority.
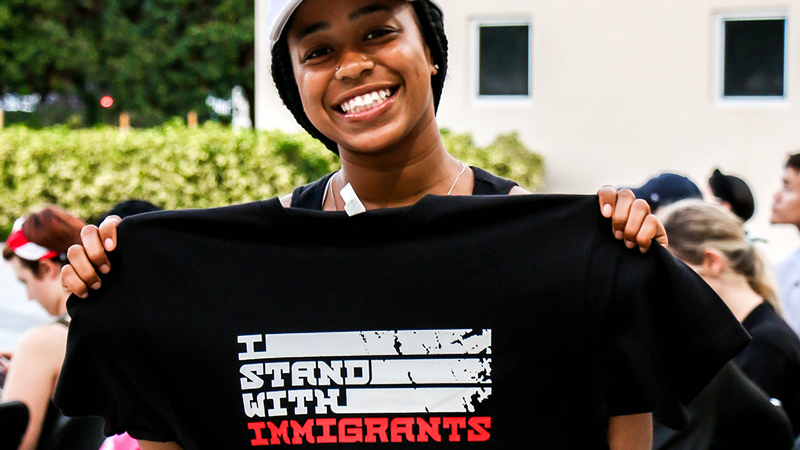
He has established partnerships with impactful organizations such as Big Brothers Big Sisters of Miami, United Way of Miami, and Casa Familia; spearheaded the creation of the President’s Community Leadership Council, a body consisting of South Florida leaders in healthcare, business, law, philanthropy, education and more; and established the Institute for Immigration Studies, an academic center dedicated to the study and understanding of the multicultural South Florida immigrant experience.
Dr. Allen came to Barry University from The Catholic University of America in Washington D.C. where he served as Vice President for Student Affairs for six years and as Associate Vice President and Director of Athletics for eight years. Additionally, he designed and implemented academic support programs for students at Florida Atlantic University and the University of Connecticut between 1993 and 2005.
President Allen holds a Bachelor of Arts from Trinity College, and a Master of Arts and Doctoral degree from the School of Education at the University of Connecticut, where his dissertation and research focused on the academic socialization and personal development of intercollegiate student athletes. He has two children, Maya and James.


