


*Total based on fall 2024 enrollment of 2,107 full-time undergraduate students.
Source: Office of Institutional Research
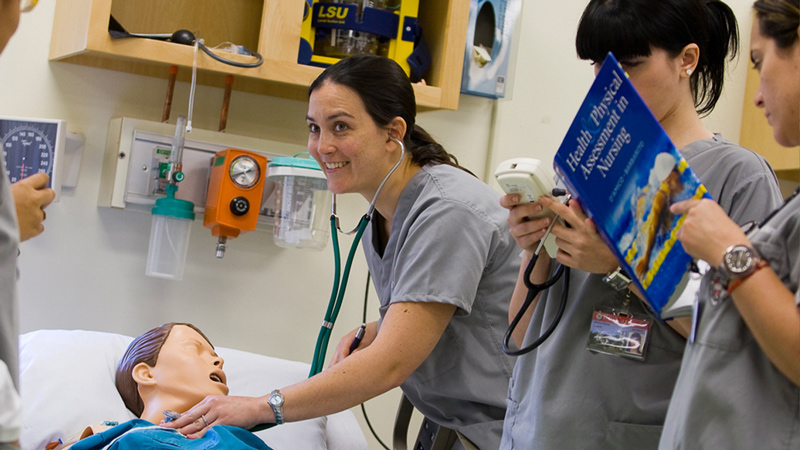
With our Catholic liberal arts heritage and over 100 degree programs, including nursing and marine biology, from bachelors through PhDs, we've got your options covered. Focus on arts and sciences, business, education, social work, communication, nursing, medical sciences, theology, or law. Take things further with personalized research and experiential learning opportunities, on and off-campus. Enhance your prospects with hands-on internships at some of the country's top organizations.

The Career and Experiential Learning Team educates students and alumni on the essential job searching and life skills to propel them to succeed in the increasingly competitive global marketplace.
Service-learning integrates relevant community service with course work and critical reflection to enrich the learning experience, foster social responsibility and civic engagement, and strengthen communities.

The Honors Program at Barry is designed to challenge, enrich, and prepare especially motivated students to pursue their fullest potential. By participating in a rigorous curriculum rounded out by an array of edifying and interactive events, students explore crucial issues that we face in our daily lives. Students are given the space for discussion and debate and the opportunity to learn from experts in their fields. The Office of Financial Aid can assist with determining eligibility for the Honors Program.

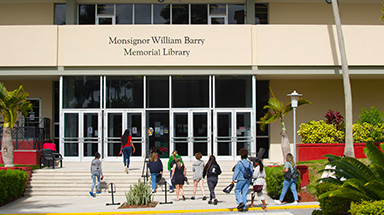
The Monsignor William Barry Memorial Library is located in the center of the beautiful Miami Shores campus of Barry University. The Library is named in loving memory of Monsignor William Barry, one of the founders of Barry University and an inspirational figure in the Catholic Church within the Archdiocese of Miami. The extensive Library research collections include more than 950,000 physical items, over 40,000 print and on-line journal subscriptions, and several thousand on-line books and streaming video resources.
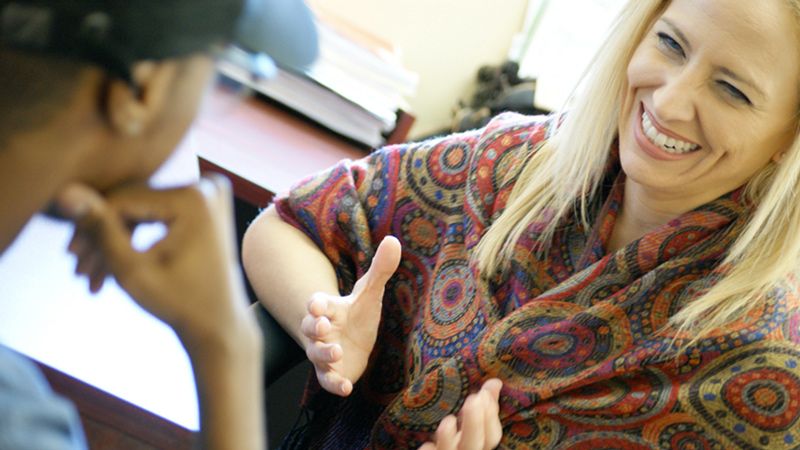
At Barry University, you will experience a small community atmosphere where you can always rely on our administrators and faculty for advice, encouragement and personal attention. We take great pride in giving individual attention from the very beginning. You can start building a personal relationship with one of our admissions counselors who will help answer any questions, and guide you through the entire admissions and enrollment process.

Continuing Education (CE) offers a variety of courses and non-credit programs designed to respond to the diverse educational interests and lifelong learning needs of individuals of all ages. We offer certificate, credential exam preparation, and licensure programs for professional and personal enrichment.

High school students: Get a jump-start on your college education with dual enrollment courses from Barry University! You can earn high school and college credit at the same time, right at your own school.
Barry University is committed to provide you with a dynamic and flexible approach to your degree pathway through our online courses and degree programs. We understand that balancing academics, work, and personal commitments can be challenging. That's why our online offerings are designed to fit seamlessly into your busy schedule, allowing you to pursue your educational goals without compromising on other important aspects of your life.

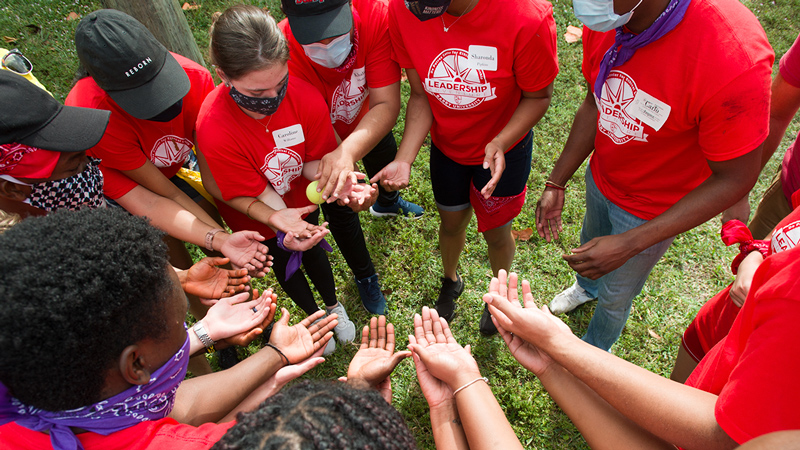
We are committed to providing programs and services that are guided by Barry University's rich educational mission and intended to enhance your Barry experience. Through partnerships with others in the university community, we aim to create experiences that will help transform you into leaders for a just and humane world.
We are an NCAA Division II school and a member of the Sunshine State Conference with 12 varsity teams, including men's baseball, basketball, golf, soccer and tennis; and women's basketball, golf, rowing, soccer, softball, tennis and volleyball. So far, we've won 24 NCAA championships, had 338 All-Americans, 413 Scholar All-Americans, and nine NCAA "Women of the Year" finalists, the most of any Division II school. Not bad at all, but we're going for more.

For students currently enrolled in classes at Barry, we have a wealth of resources you can tap into to bring ease and efficiency to your university experience. Get the help you need with administrative or financial questions, or check out course catalogs to help plan your schedule by semester. All the information you need to excel is at your fingertips.


*Total based on fall 2024 enrollment of 2,107 full-time undergraduate students.
Source: Office of Institutional Research
*Total based on fall 2024 enrollment of 2,107 full-time undergraduate students.
Source: Office of Institutional Research
Source: Office of Institutional Research
Source: Office of Institutional Research
Source: Office of Institutional Research
Completion/Graduation Rates for Students Receiving Athletically Related Student AID
Information on Enrollment and Completion/Graduation Rates for Students Receiving Athletically Related Student Aid is available at:
http://gobarrybucs.com/sports/2016/5/25/academic-success.aspx?path=academics
Gender Equity in Athletics
Information on Intercollegiate Athletic Program Participation Rates and Financial
Support Data is available at:
https://ope.ed.gov/athletics/#/
In the graph below you can find the top Graduate programs at Barry, that students enrolled in within a year of completing an undergraduate degree at our Institution.
Source: Office of Institutional Research
Employment and Earnings
The employment rate within Florida for Barry University graduates with an undergraduate degree is higher than the average rate for graduates from other independent colleges and universities in Florida and comparable to the average employment rate from Florida public universities. The average salary for Barry University graduates with undergraduate degrees is higher than the average salary for graduates from independent and public universities. Complete details of Barry University FETPIP related documents can be found at the following website: www.barry.edu/institutional-research/fetpip.html
*Independent Colleges and Universities of Florida. Complete details of Barry University FETPIP related documents can be found at the following website: https://www.barry.edu/en/institutional-research/#fetpip
The Florida Education and Training Placement Information Program (FETPIP) is a data collection and consumer reporting system established by the Florida statute. The purpose of FETPIP is to track students who have graduated, exited, or completed an educational or training program within the State of Florida. Among other services, the FETPIP tracking system reports on within-state employment of students following graduation from a college or university in the state. Complete details of this program can be found at the following website: http://www.fldoe.org/accountability/fl-edu-training-placement-info-program/
For additional information on Student Outcomes visit College Navigator webpage.