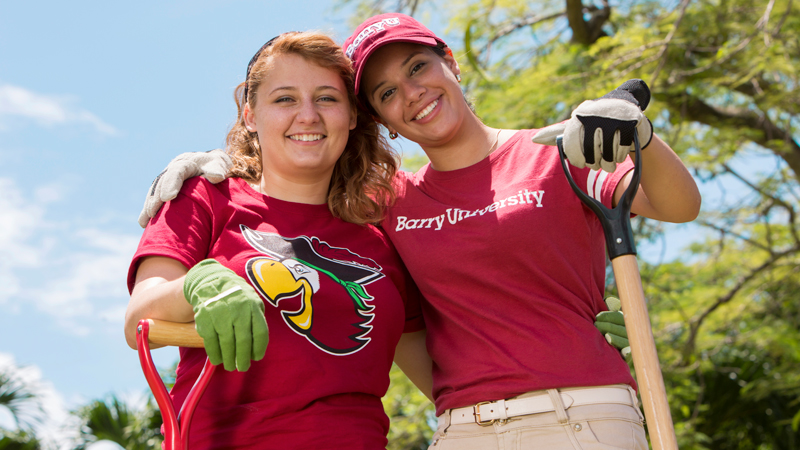
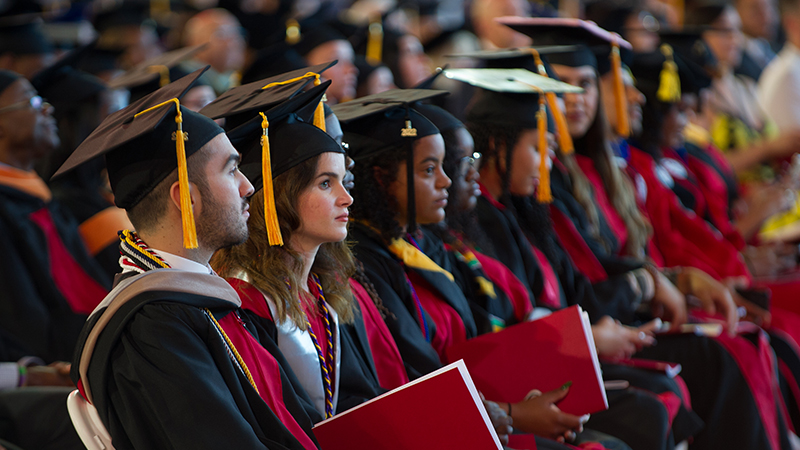
Our active-learning, highly collaborative, small-group approach lets you study medical sciences and health professions in an environment designed to provide you with numerous healthcare career pathways. Plus, you won’t have to wait for hands-on experience: with our experiential and service learning focus, you’ll be actively enhancing your skills practically as soon as you arrive.
The College for the Healthcare Professional You Want to Be
Meet our Executive Dean and Professor Eneida Roldán: MD, MPH, MBA Our Mission and Vision: A Collaborative Approach to Healthcare Education
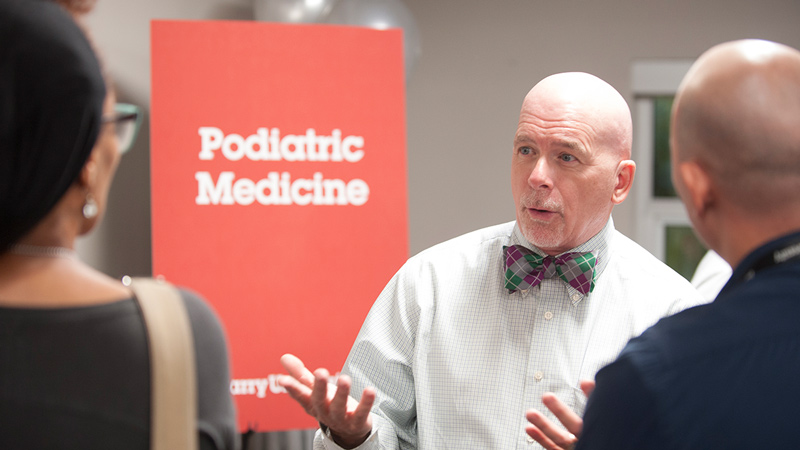
The College of Health Professions & Medical Sciences offers interdisciplinary undergraduate and graduate programs through the Schools of Podiatric Medicine, Nursing, Mental Health and Social Work along with departments in Health Sciences, Physician Assistant Studies, and Emergency Management, as well as mental health and podiatry clinics. To develop essential skills and gain insight into diverse healthcare practices and career pathways, students interact with practicing professionals in our community and across strategic partnerships. Our dynamic curriculum, immersive clinical experiences, and a commitment to service, so our graduates are fully prepared to succeed in the complex healthcare ecosystem.

Lead the Future of Healthcare With a Dynamic, Interdisciplinary Education
At Barry University, learning goes beyond the classroom – it’s in every experience, interaction, and hands-on opportunity. Our small class sizes mean personalized support. You won’t just study healthcare – you’ll practice it, surrounded by a network of mentors and peers.
Are you ready to step into an interdisciplinary ecosystem where collaboration leads to innovation and real-world impact?
-

Interdisciplinary Education
Healthcare doesn’t work in silos – and neither do we. At the College of Health Professions & Medical Sciences, you’ll learn alongside future nurses, podiatrists, physician assistants, mental health counselors, and emergency management professionals. This cross-disciplinary approach gives you a well-rounded understanding of how every role works together to deliver quality care in hospitals and clinics.
-

Experiential and Service-Learning Focus
In the ever-changing field of healthcare, the world is your classroom, and at Barry, we’ll ensure that you are ready to step into it from day one. Whether you're responding to emergencies, supporting mental wellness, or caring for patients in local or global communities – like our podiatric medical students did in the Bahamas – your learning is grounded in real needs, real people, and real outcomes.
-

Peer Collaboration
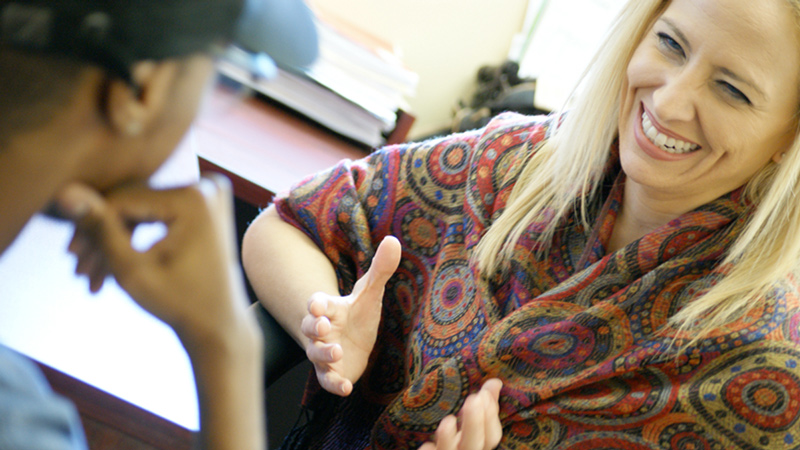
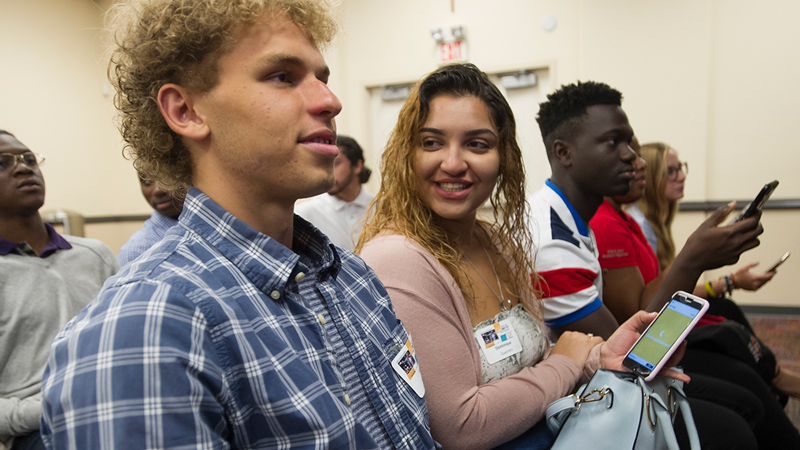
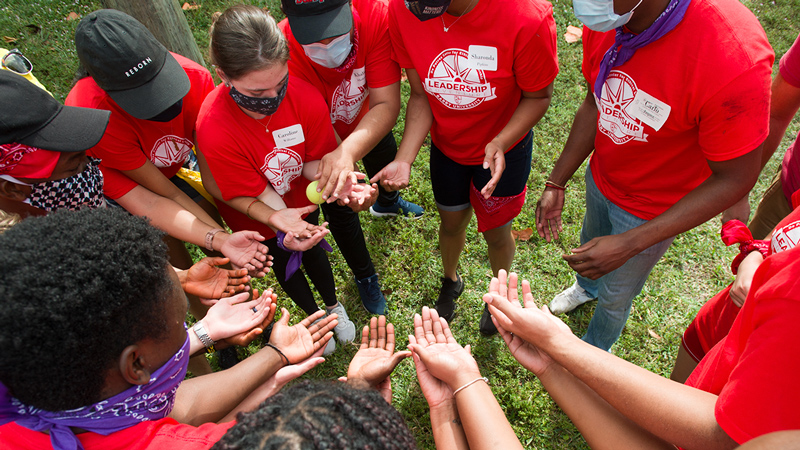
At Barry, you won’t be just another name on the roster. Our small class sizes mean professors know your name and your goals. You’ll grow alongside classmates who challenge and support you.
-

Multiple Simulation Labs
Barry University offers cutting-edge simulation labs that give students hands-on, real-world training across disciplines. From the Nursing Simulation Learning Center with life-like mannequins, to the Motion Analysis Center for human movement studies, to advanced Clinical and Anatomy Labs, these environments prepare students to confidently succeed in all types of medical settings.
-

AI-Embedded Coursework
Integrating AI into healthcare coursework equips students with critical skills for a rapidly evolving medical landscape. By learning to work alongside AI tools, students gain a deeper understanding of how data can enhance patient care, streamline clinical workflows, and support ethical and effective decision-making.
Personalized Support That Powers You Forward
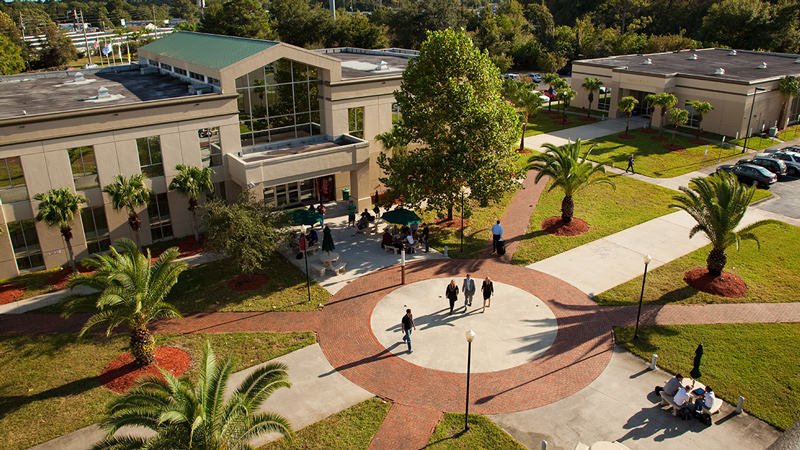
From the moment you step on campus, you’ll have access to a network of services designed to help you thrive, including the Center for Academic Success and Advising (CASA), the Glenn Hubert Learning Center, and dedicated physical and mental health resources. With the right support, there are no limits to what you can achieve.
Academic Support
Through the Center for Academic Success and Advising (CASA), every student is assigned a success coach for their first two years. Your success coach guides you with class registration, goal setting, workshops, and regular check-ins to keep you on track. And when you need extra help, the Glenn Hubert Learning Center has you covered with professional tutors specializing in reading, writing, and math.
Mentorship
Our faculty are more than educators; they’re researchers, experts, and changemakers committed to guiding the next generation of healthcare leaders, frontline professionals, and innovators.


Interdisciplinary, Impactful, Innovative
At Barry University, we’re redefining healthcare education. Our programs go beyond the classroom, blending interdisciplinary learning, hands-on experience, community service, and personalized support to empower you to enter the field of healthcare with power and purpose. From our extensive network of partner hospitals to our specialized health clinics, you’ll gain the expertise needed to make a meaningful impact from day one.
Innovation That Moves Healthcare Forward
At Barry University, we are ready to lead the way in health-tech. With AI integrated across the curriculum, our students are learning how to use emerging technologies to solve real-world challenges.
A Strong Partnership Network
Located in one of the most vibrant and dynamic cities, Barry students have direct access to South Florida’s leading hospitals as well as community, national and international clinical partners. These include Barry Health Partners: Foot and Ankle Institute, a network of Podiatry Clincs, and the community CARE Center, that offers mental health counseling, assessment, education and research.

Get all your questions answered at a convenient virtual info session including application assistance.
Six Pillars, Multiple Healthcare Career Pathways
Department of Health Sciences and Clinical Practice
- Bachelor of Science in Kinesiology & Sports Sciences (BS)
- Bachelor of Science in Exercise Physiology (BS)
- Master of Science in Kinesiology & Human Performance
- Sport, Exercise and Performance Psychology (MS)
- Master of Science in Occupational Therapy (MS)
- Master of Science in Biomedical Sciences (MS)
- Clinical Laboratory Sciences

